
This page provides somewhat detailed information on the metrics that appear on reports of Student Experience of Instruction (SEI) surveys.
Response Rates
The goal of reporting SEI data is to succinctly capture elements of the response distribution to form an aggregate assessment of student feedback on instruction. Of course, not all students in a given course complete the survey. How do we understand those responses relative to the whole class, including those who did not respond? How confident can we be in drawing conclusions or inferences from the data?
One important consideration is response rates: What response rates are needed in what size of class, and how confident can we be in the aggregate data derived from the responses? Two key factors that influence what the minimum response rates should be for a given class are the confidence level we desire to have in the data and its margin of error. Historically at UBC, we have adopted a confidence level of 80% with a 10% margin of error for SEI responses.
The calculated minimum response rates, based on the underlying variability of historical UBC data, for 80% confidence and 10% margin of error are shown in Table 1 below, as a function of class size.1
| Class Size | Recommended Minimum Response Rates based on 80% confidence & ± 10% margin |
| < 10 | 75% |
| 11 – 19 | 65% |
| 20 – 34 | 55% |
| 35 – 49 | 40% |
| 50 – 74 | 35% |
| 75 – 99 | 25% |
| 100 – 149 | 20% |
| 150 – 299 | 15% |
| 300 – 499 | 10% |
| > 500 | 5% |
For example, if the feedback survey for a class of 60 students fails to meet a response rate of 35%, it means that we can expect a lower confidence and larger error in the measurement. SEOI results from response rates that do not meet the minimum recommended should be interpreted with care and within context, particularly if they are an anomaly.
Percent Favourable rating
Percent favourable rating (PF) expresses the number of favourable ratings (Agree or Strongly Agree), as a percentage of the total number of students’ responses.
Recall the example of course (a) and course (b), scenarios that depict very different response distributions, yet with the same mean score:
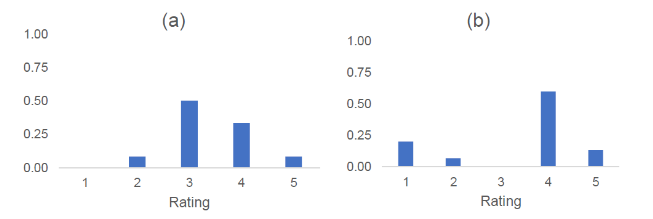
In Course (a), out of a total of 12 students, 4 chose Agree and 1 chose Strongly Agree; the course therefore has a PF value of 42%. In Course (b), out of a total of 15 students, 9 chose Agree and 2 chose Strongly Agree, yielding a PF value of 73%.
Interpolated median (IM)
The median is a measure of central tendency that divides the scores in half, such that as many scores fall above as below. The interpolationed median (IM) adjusts the standard median (50th percentile) upwards or downwards depending on the distribution of scores that are greater than, less than, or equal to the median. The IM therefore better reflects the distribution of scores than the median, as explained below.
The IM is calculated using the following formula:2

Where:
- IM = the Interpolated Median
- M = the Median
- n = number of data points equal to the median
- n+ = number of data points greater than the median
- n– = number of data points less than the median
This expression is only valid if n is not zero (i.e., some data point in the distribution is equal to the median value) otherwise, the interpolated median is simply the median. The IM makes a small upwards or downwards correction to the median value, reflecting the distribution of data points above or below the median value.
This is illustrated below (Figure 2) with the data from the two response distributions in Figure 1. The median for course (a) is 3, and for course (b) the median is 4. The mean for both courses is 3.4, while the IM values are 3.3 for Course (a) and 3.9 for Course (b), providing a clear way to distinguish different distributions in comparison to the mean.
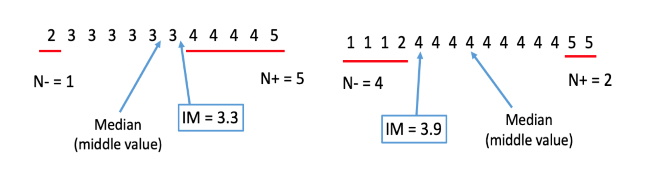
In course (a), respondent choices are almost all either a 3 or a 4, so the IM (3.3) is very similar to the mean (3.4). However, in course (b), 20% of respondents chose strongly disagree (labelled by the number 1), although more respondents chose agree and strongly agree (4 and 5, respectively); thus, the IM (3.9) is higher than the mean (3.4). Furthermore, the IM is closely related to percent favourable rating. Recall from above that course (a) has a percent favourable rating of 42% (IM of 3.3), compared to 73% for course (b) with an IM of 3.9.
The IM does a better job of taking into account all respondents’ feedback than the mean (or the median) when estimating the central tendency of the response data. We have also added to this indicator a measure of variability to get a sense of how much respondents converge around or differ from that IM, a measure of dispersion or spread—explained in the next section.
Dispersion Index
The dispersion index (DI) is a measure of variability suitable for ordinal data such as that from SEOI, and avoids statistical assumptions associated with standard deviation (i.e., that scores are normally distributed). The formula for the dispersion index is as follows:3
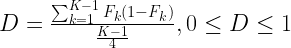
Where: D is the dispersion index; k = 1, 2…; K are the categories of possible responses for each question; and Fk is the relative cumulative distribution function of the responses.
A DI of zero indicates that all students in the section gave the same rating to the instructor, whereas a DI of 1 is obtained when the class splits evenly between the two extreme values (Strongly Disagree & Strongly Agree). In UBC data, the dispersion index rarely exceeds 0.7, and such high dispersion is often found in ratings that did not meet the minimum recommended response rate. For example, of the 4,734 evaluations that met the minimum response rate in 2018W, only 39 had a UMI dispersion index that exceeded 0.7.
Resources
Learn more about these metrics:
- Proposed metrics for summarizing student evaluation of teaching data from balanced Likert scale surveys
- CTLT Workshop on Student Experience of Instruction Metrics
1 Zumrawi, A., Bates, S. & Schroeder, M (2014). What response rates are needed to make reliable inferences from student evaluations of teaching? Educational Research and Evaluation: An International Journal on Theory and Practice, 20:7-8, 557-563.
2 Ames, W. F., Guilford, J. P., & Fruchter, B. (1978). Fundamental statistics in psychology and education: McGraw-Hill.
3 Rampichini, C., Grilli, L. & Petrucci, A (2004). Analysis of university course evaluations: from descriptive measures to multilevel models. Statistical Methods & Applications 13, 357–373 (2004).