
Recently, UBC began using different metrics to report student experience survey results1. This page provides a brief overview of those changes; please see the following pages for more information.
Overview of SEI metrics
Student experience of instruction quantitative data consists of responses on a Likert-type scale. For example, in response to the University Module Items (UMI) students choose answers from strongly disagree, disagree, neutral, agree, and strongly agree. These responses are converted to numerical values of 1 to 5. The data from the surveys is categorical and ordinal in nature.2
When analyzing numerical data from student surveys, we try to capture two main ideas: the middle (often called central tendency), and how much individual scores converge around or spread away from that middle (often called variability). Different ways exist to capture each of these ideas numerically.
For many years, UBC reported the arithmetic average (“mean”) and standard deviation of student responses to each of the UMI items; the two capture the central tendency and variability, respectively. Although this choice is common practice, these values can disguise important differences in distributions of student responses–differences that are important when using these values for evaluating teaching.
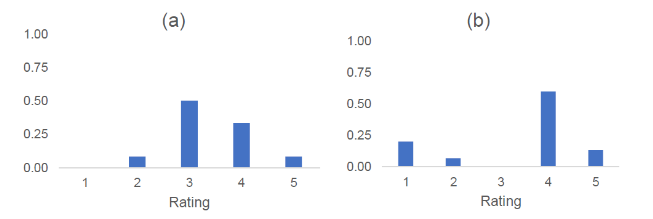
To illustrate, consider the following two distributions of student responses in two hypothetical courses, (a) and (b). (Note that the number of respondents is very low for illustrative purposes.)
| Scale value/rating | Number of students selected (frequency) | Scale value/rating | Number of students selected (frequency) |
| 1 strongly disagree | 0 | 1 strongly disagree | 3 |
| 2 disagree | 1 | 2 disagree | 1 |
| 3 neutral | 6 | 3 neutral | 0 |
| 4 agree | 4 | 4 agree | 9 |
| 5 strongly agree | 1 | 5 strongly agree | 2 |
| Total respondents (a) | 12 | Total respondents (b) | 15 |
| Mean | 3.4 | Mean | 3.4 |
The two distributions have the same mean score (3.4), yet the distribution of these scores across the categories 1-5 is markedly different. In addition, we can see that the percentage of students who chose 4 or 5 (agree or strongly agree) also differs significantly: 42% for course (a) and 73% for course (b).
To better capture these differences, UBC has moved to reporting the interpolated median (IM) as a measure of central tendency rather than the mean, and the dispersion index (DI) as a measure of variability rather than the standard deviation. Also reported are response rate (the percentage of students responding out of the number of students registered in the course) and percent favourable rating (PF): the percentage of students who chose 4 or 5 in response to each question, as a percentage of total respondents.
Please see the Reported Metrics page for more information on the interpolated median, dispersion index, and the percent favourable rating. In addition, that page provides information on recommended response rates depending on the size of the course.
1 Zumrawi, A. A., & Macfadyen, L. P. (2023). Proposed metrics for summarizing student evaluation of teaching data from balanced Likert scale surveys. Cogent Education, 10(2). https://doi.org/10.1080/2331186X.2023.2254665
2 i.e., it is split into categories that have a meaningful order but there are not equal intervals between the categories (such as there is in interval data). Though Likert scales may be thought to yield interval data, often there are not equal intervals between the categories; e.g., the interval differences between strongly disagree, disagree, neutral, agree, and strongly agree may not be exactly equal.